tokenmax
I redesigned the whole look of tokenmax, the members-only board my friends and I use to track how much we use our coding agents.
The redesign is live and it's what everyone sees after signing in.
- For
- Me and friends
- Role
- Design
- When
- Aug 2026
- Stack
- Next.js
- Supabase
- Vercel
- Members only
I redesigned a board my friends and I use
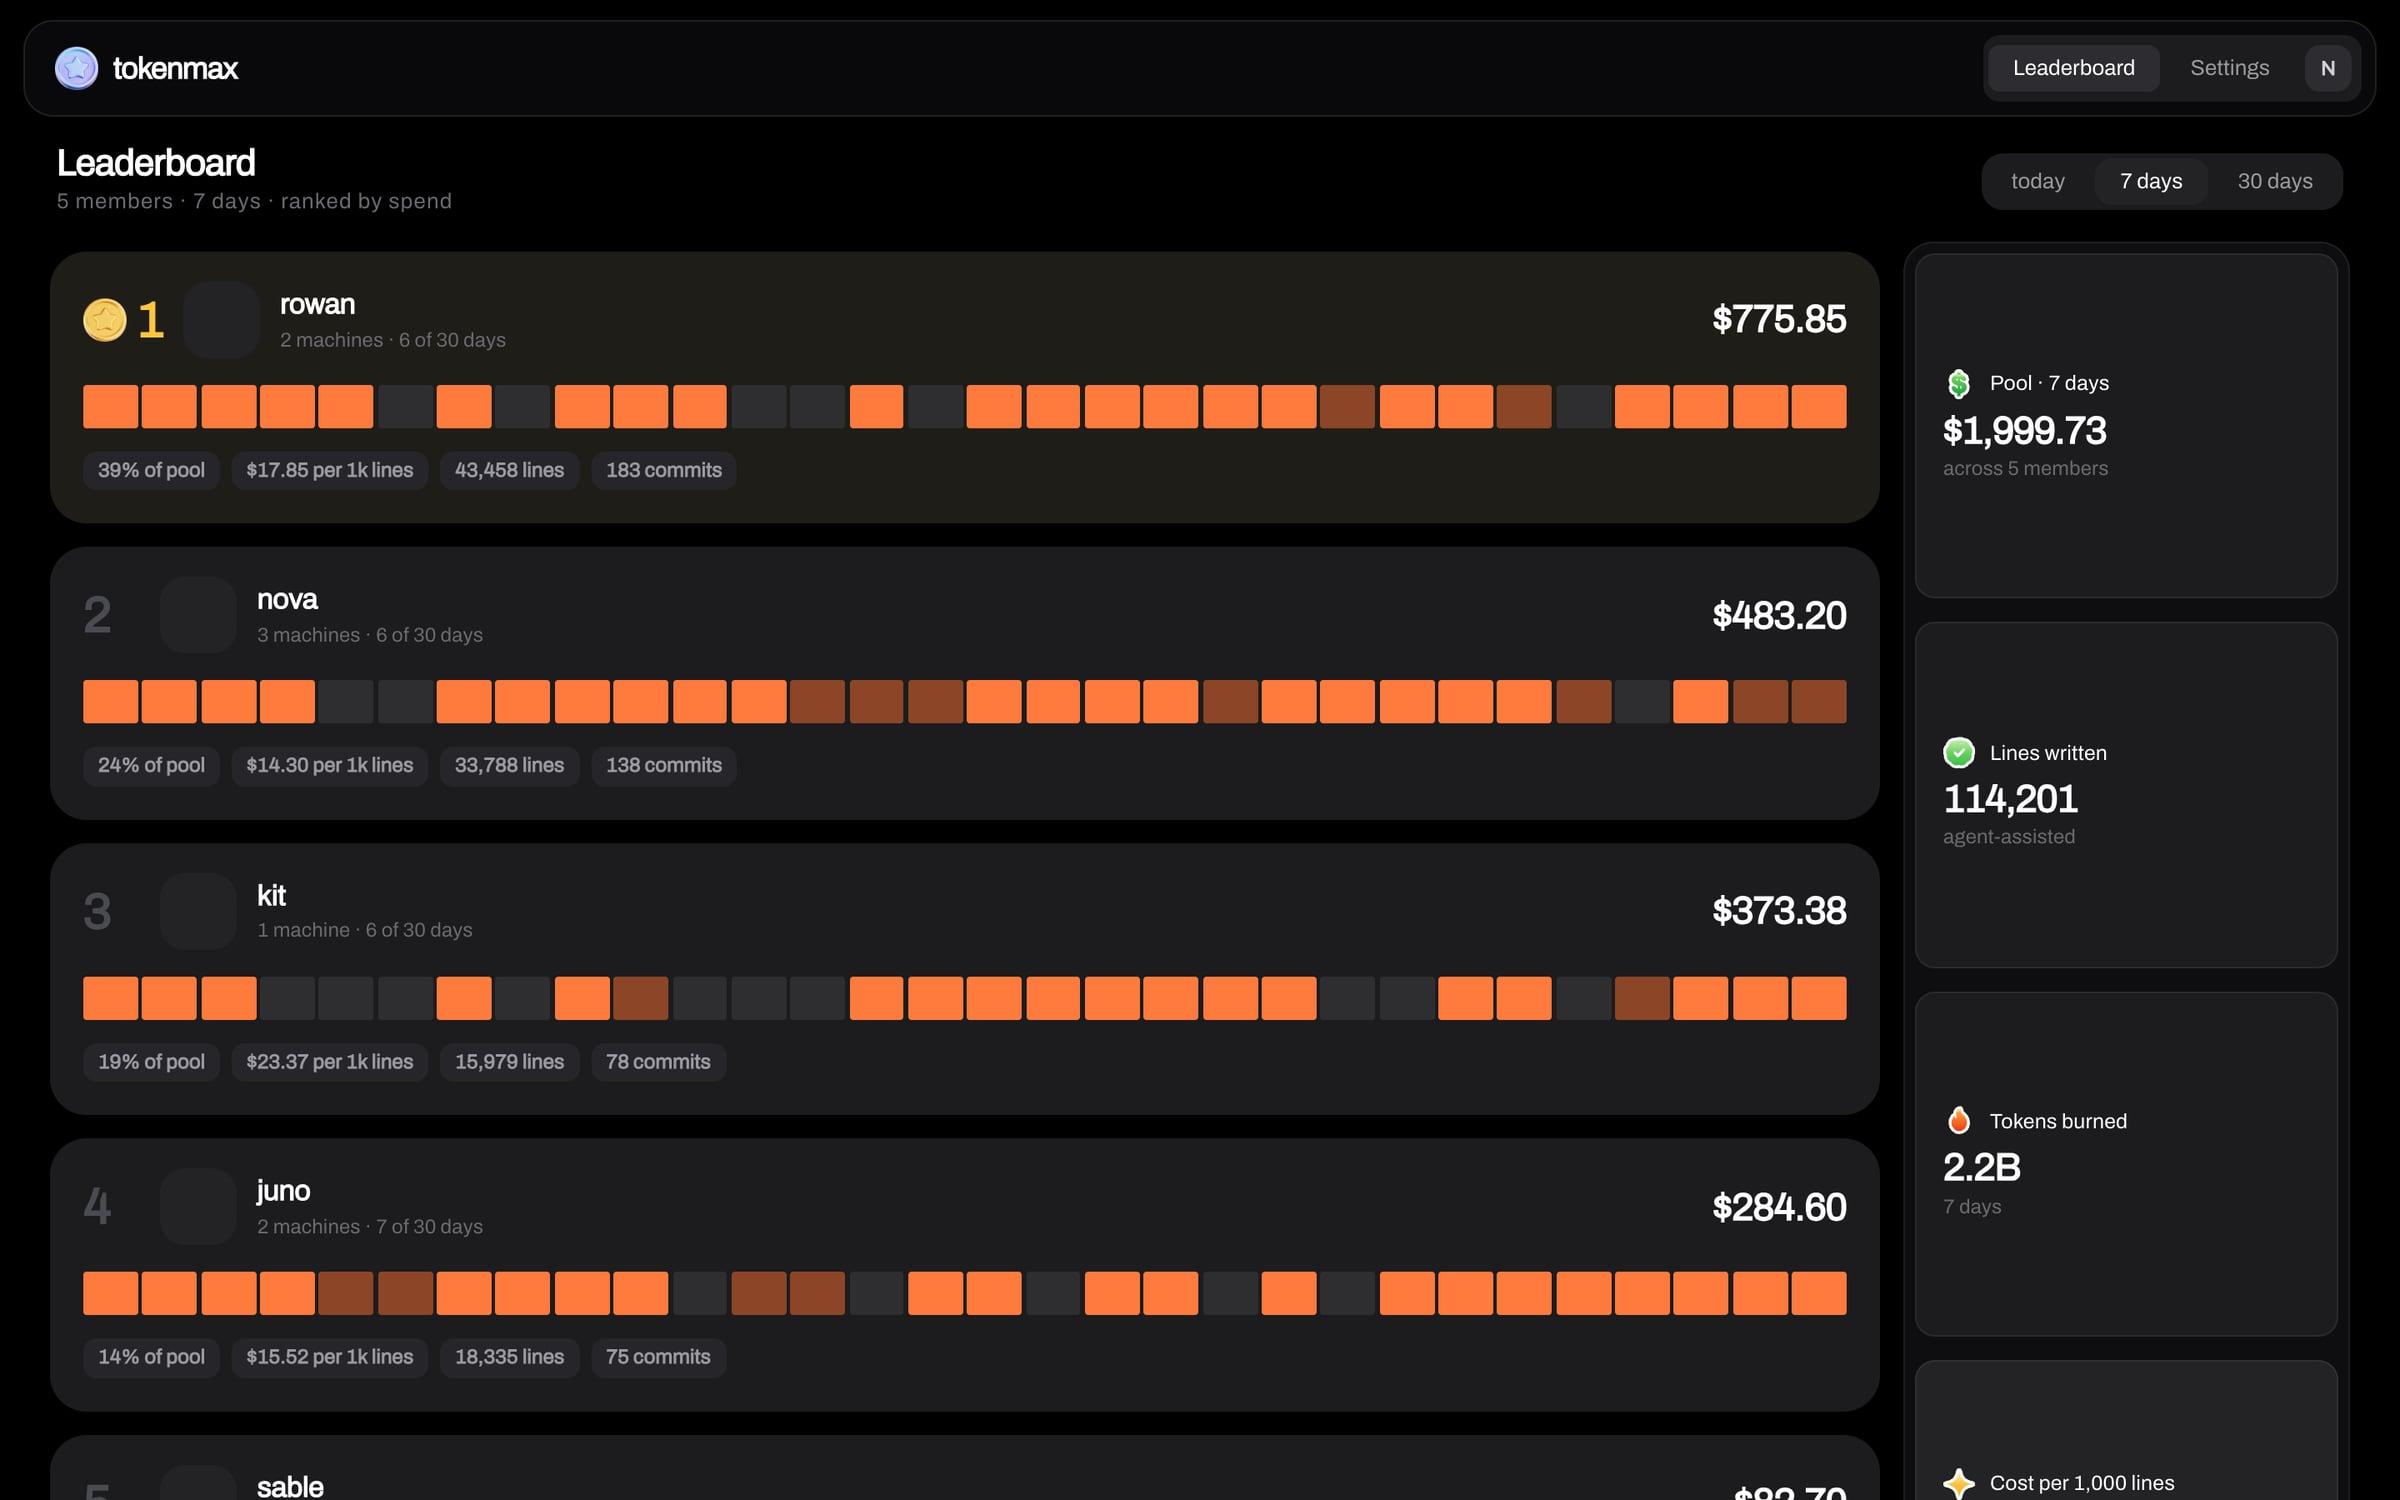
tokenmax is a board my friends and I use. A small command line tool reads what Claude Code and Codex already write to disk and posts each day's totals to a board only members can see. It started as a dark console with a starfield, and I redesigned the whole look. The job was to keep that swagger and get it out of looking vibecoded.
I went through forty directions in a week
Over a week I looked at more than forty directions and threw out nearly all of them. The tidy ones were just text and colour and one font. A faceplate styled like lab equipment got picked and shipped, then came out within a day once I saw it in the app, because it wasn't clear.
I rebuilt it on the Bevel app's widgets in dark mode
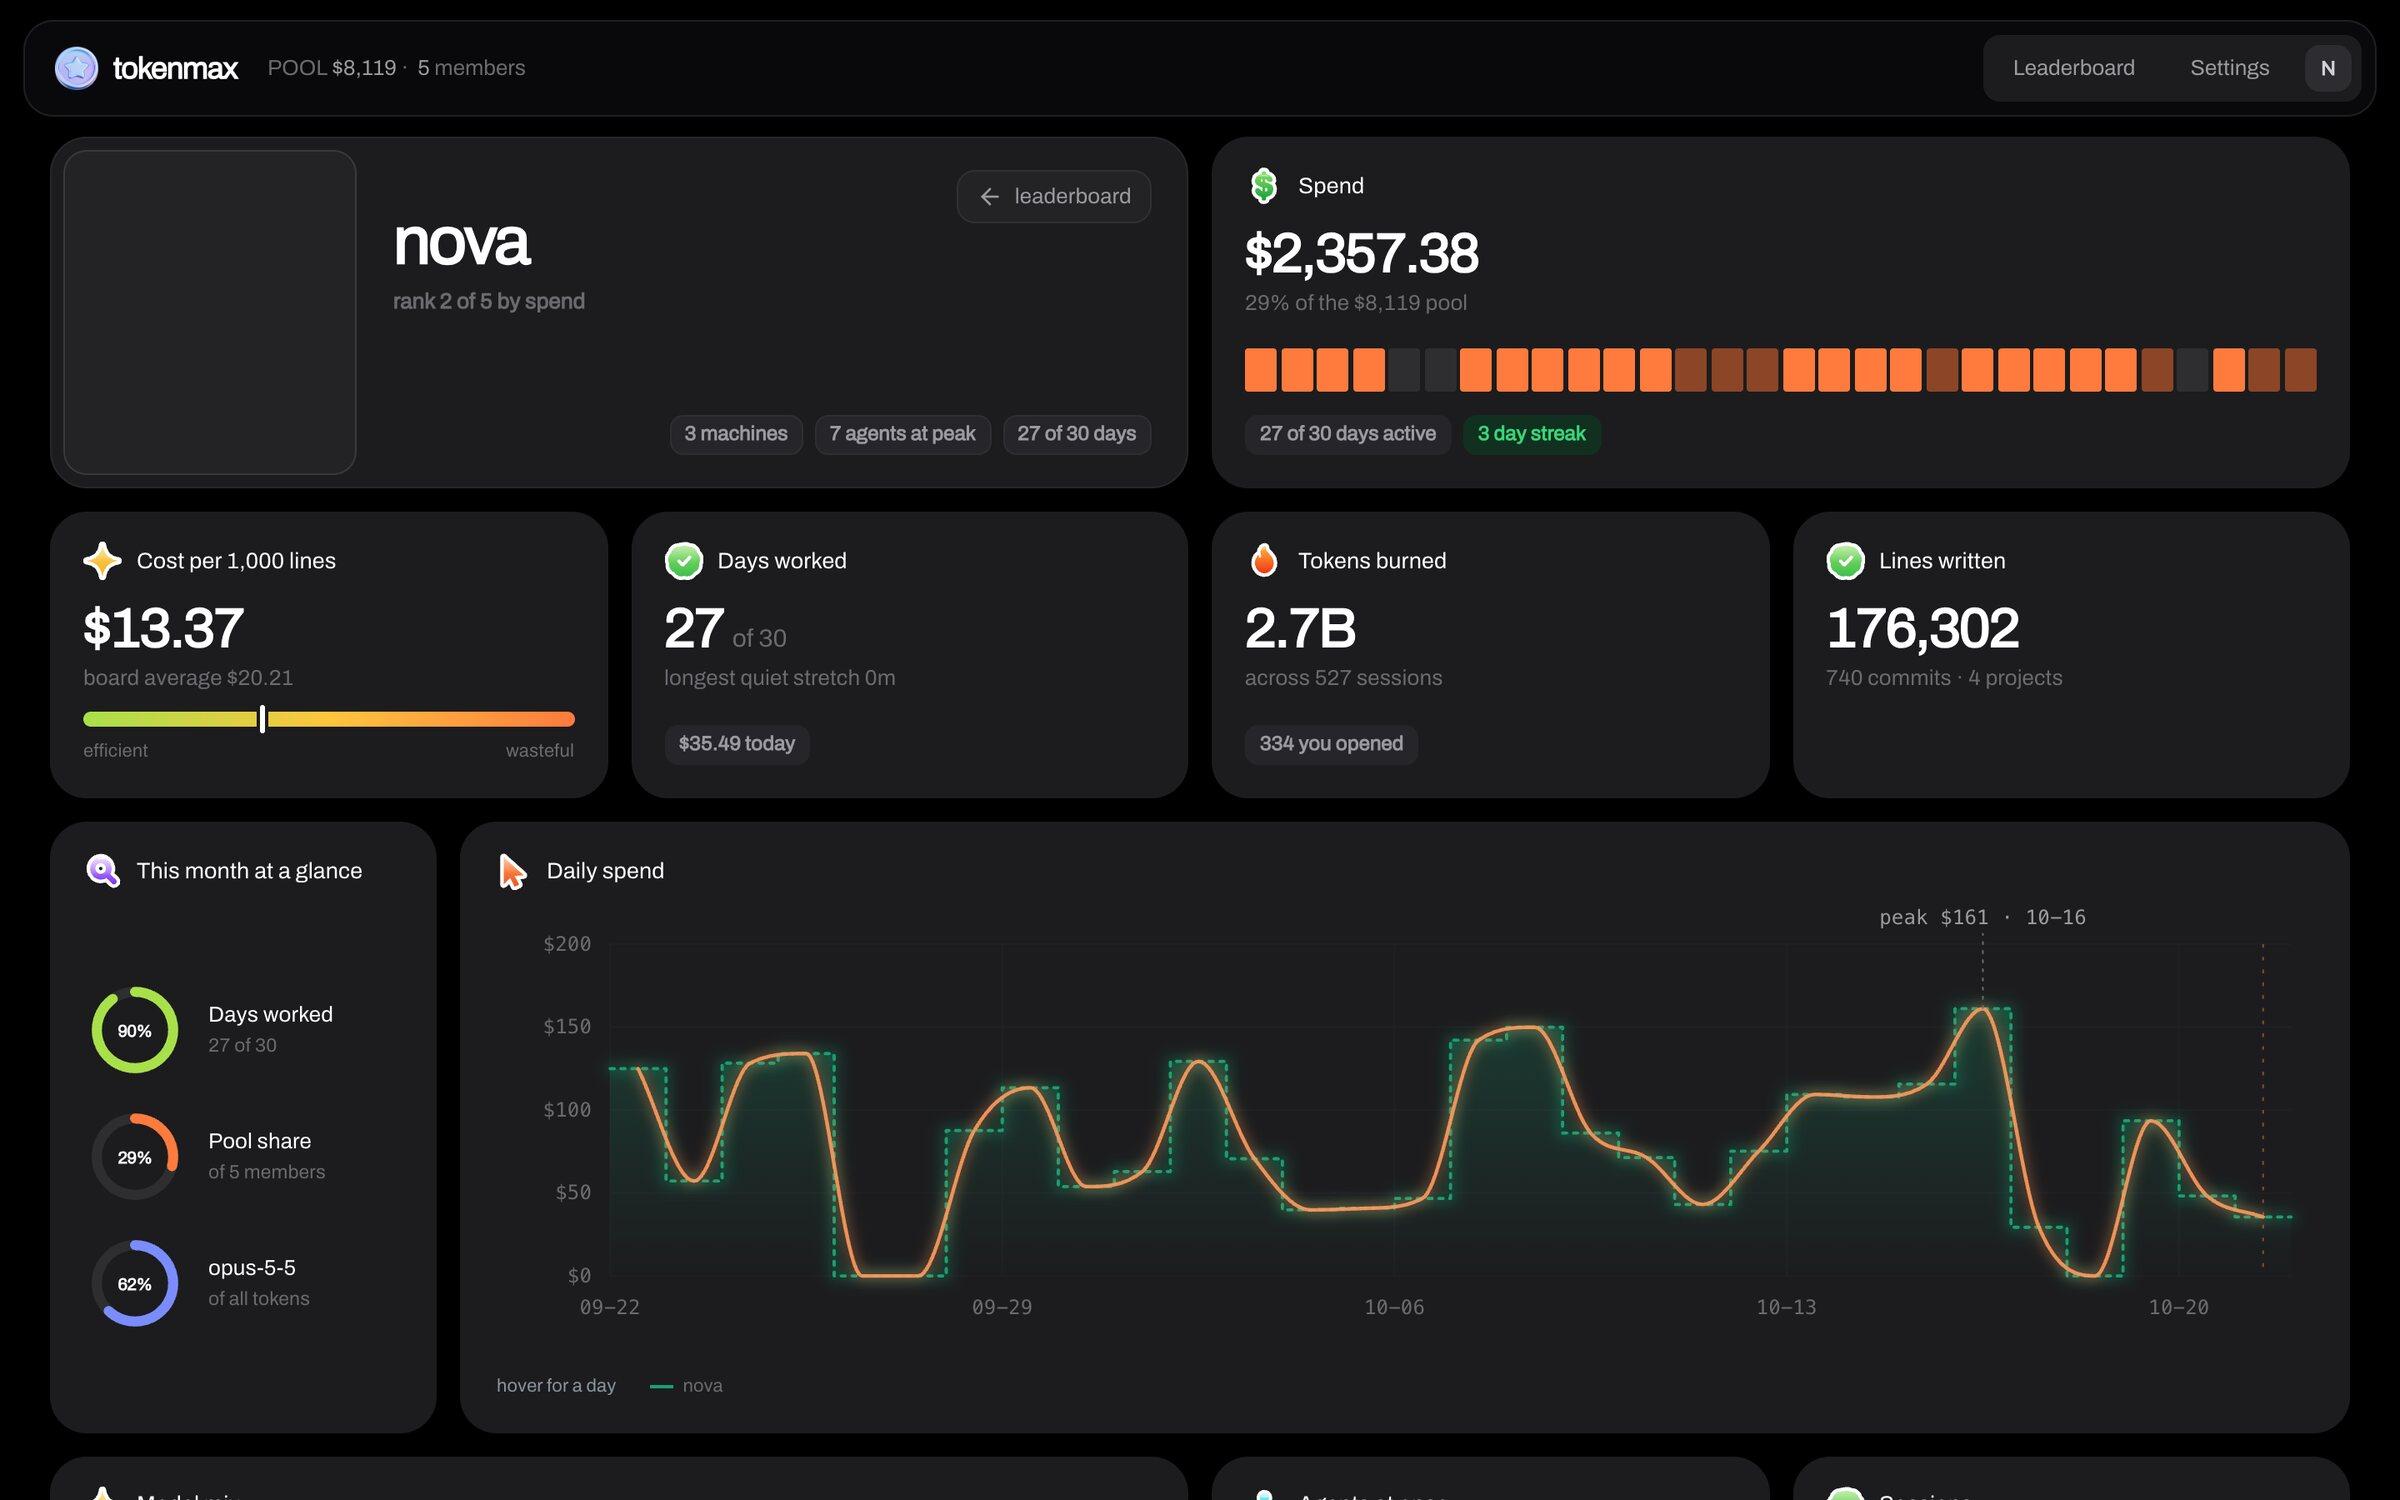
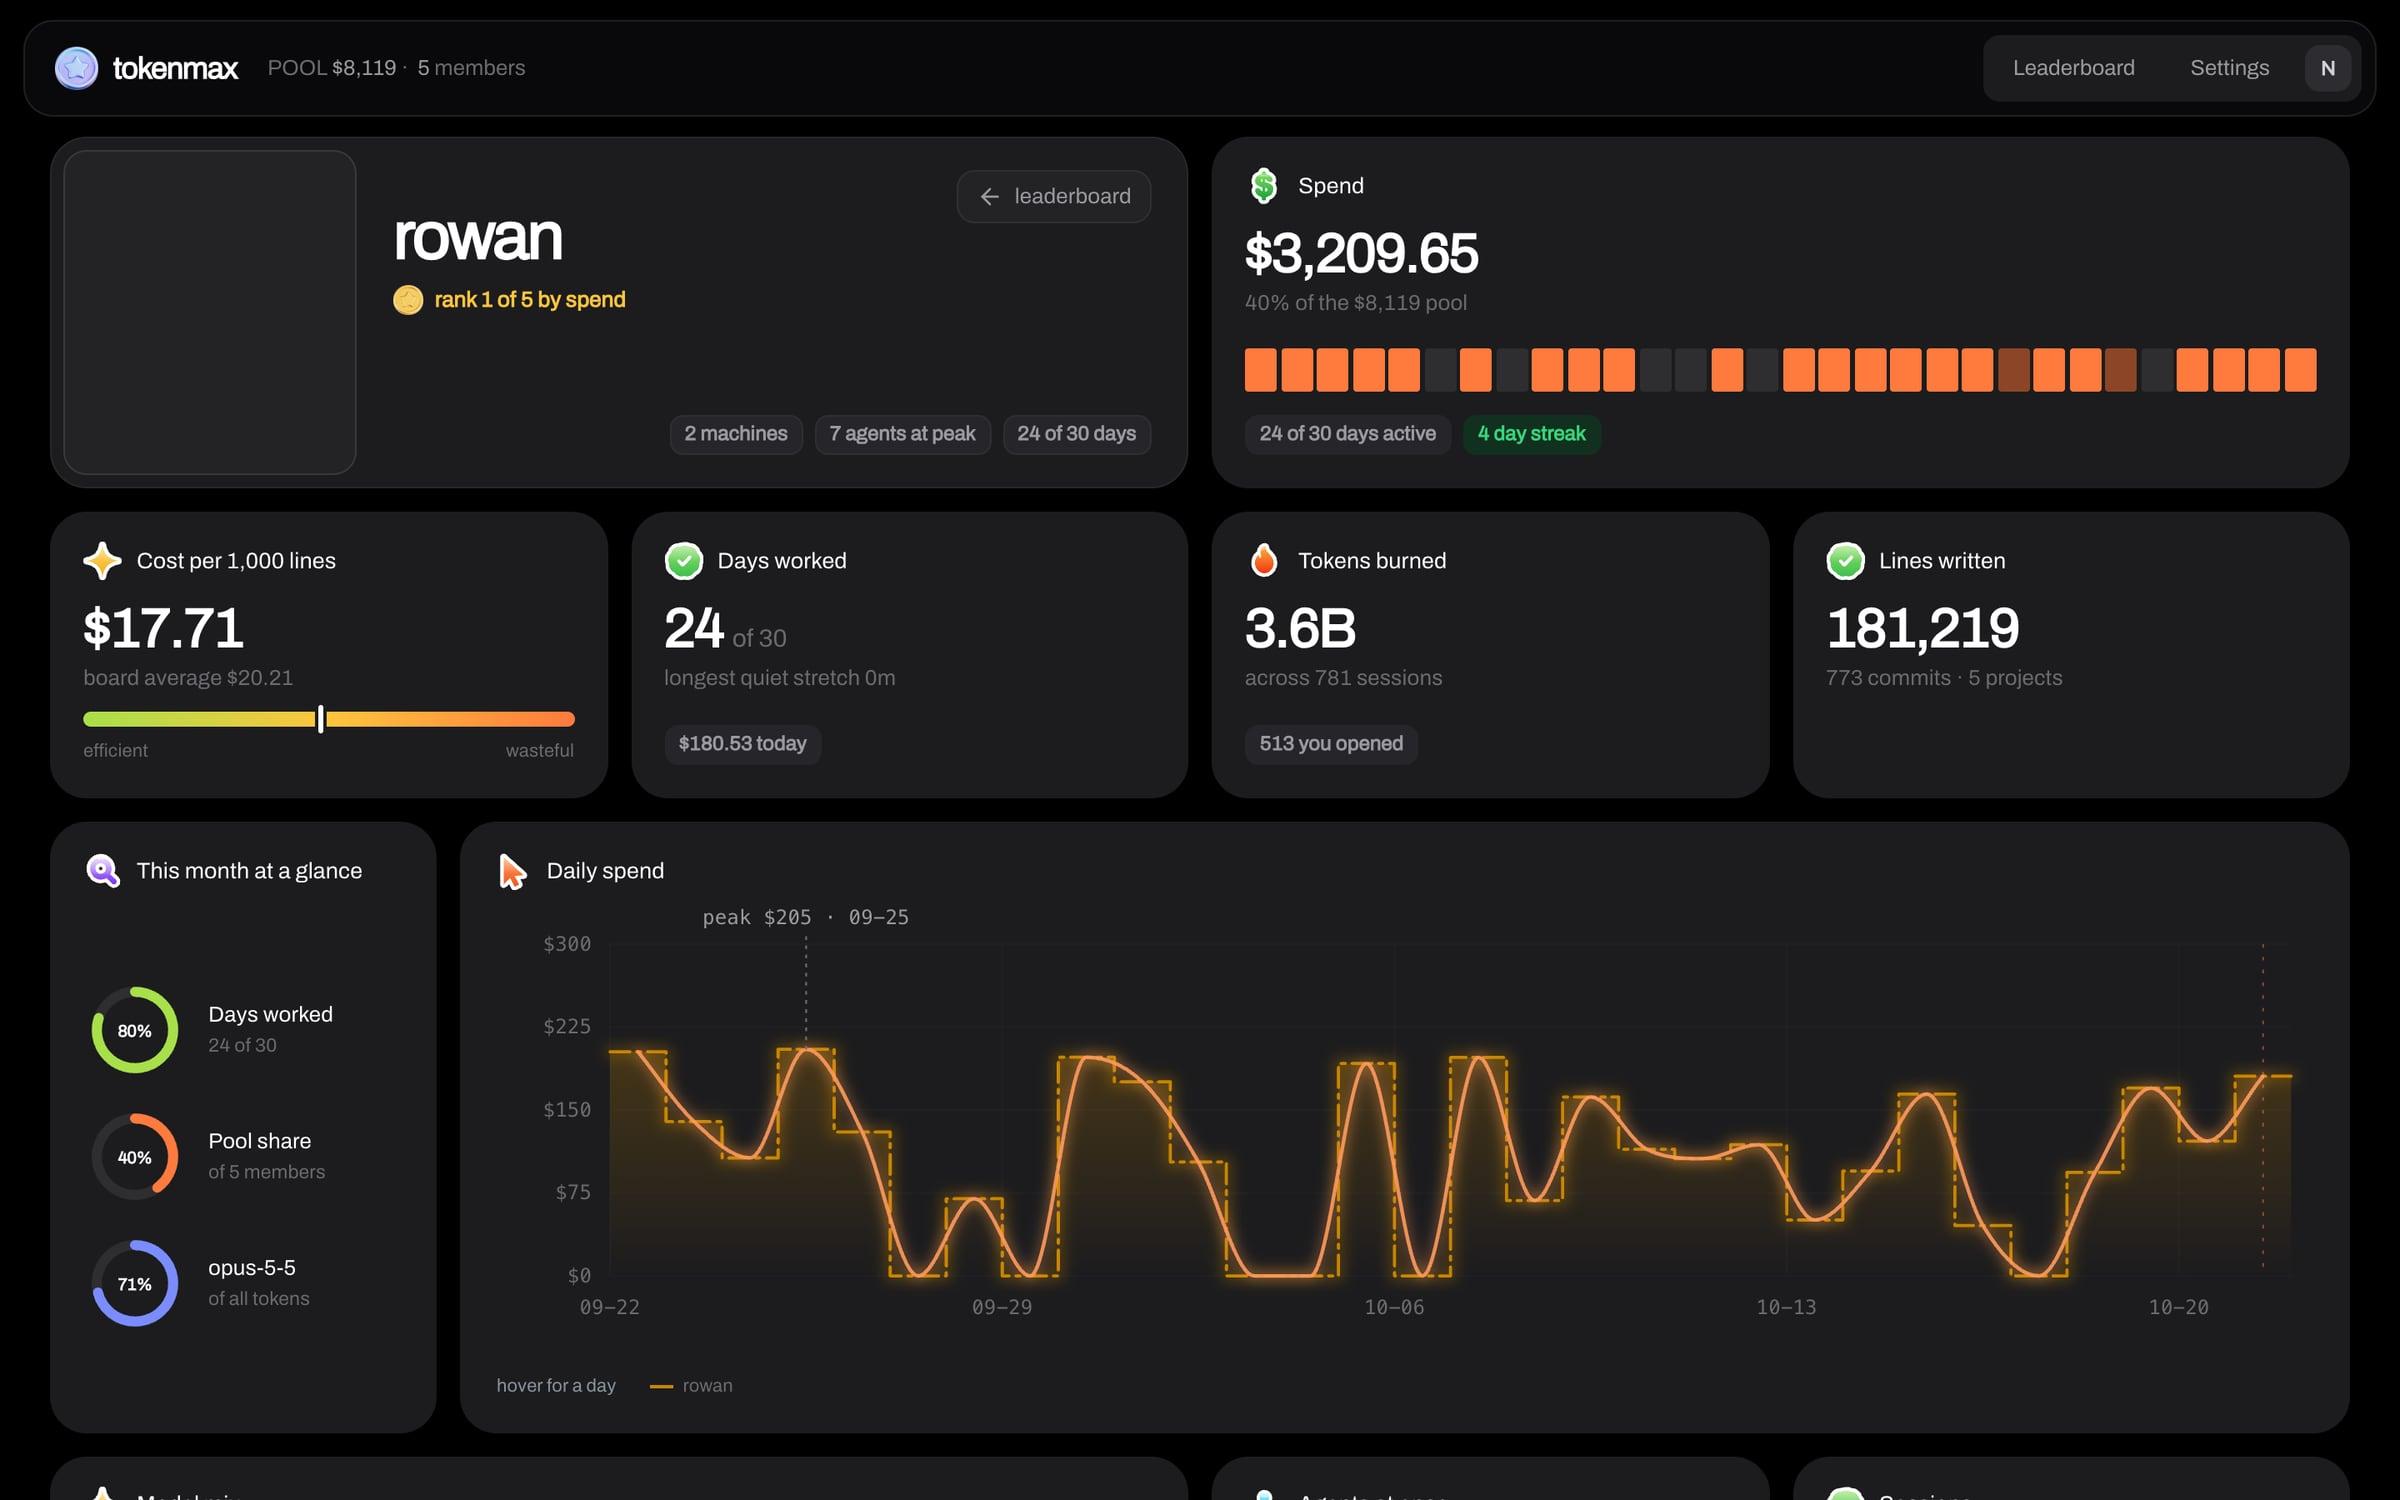
What stuck came from a photo I sent of the Bevel health app's widgets, rebuilt in dark mode. Every metric is a rounded tile on black with a sticker icon by its title, one big number and thick ring gauges, and the labels say things like Days worked and Agents at once. On the leaderboard each member is a tile you click into instead of a row in a table, and gold only ever marks first place.